Rip Currents are
powerful currents of water flowing away from shore. They typically extend from the
shoreline through the surf zone. Rip currents generally
form when waves approach near normal to the shoreline. Rip currents can occur
at any beaches with breaking waves, including beaches on open oceans, in the lake
and in a Bay.
|
Basic Rip Current Mechanism
- Waves break on the sand bars before they break in the channel area.
- Wave breaking causes an increase in water level over the bars relative to the channel level.
- A pressure gradient is created due to the higher water level over the bars.
- This pressure gradient drives a current alongshore (the feeder current).
- The longshore currents converge and turn seaward, flowing through the low area or channel between the sand bars.
|
|
More in the COMET module
"Rip Currents: Nearshore Fundamentals".
|
Rip Current Types
There are several types of Rip Currents.
Here are examples:
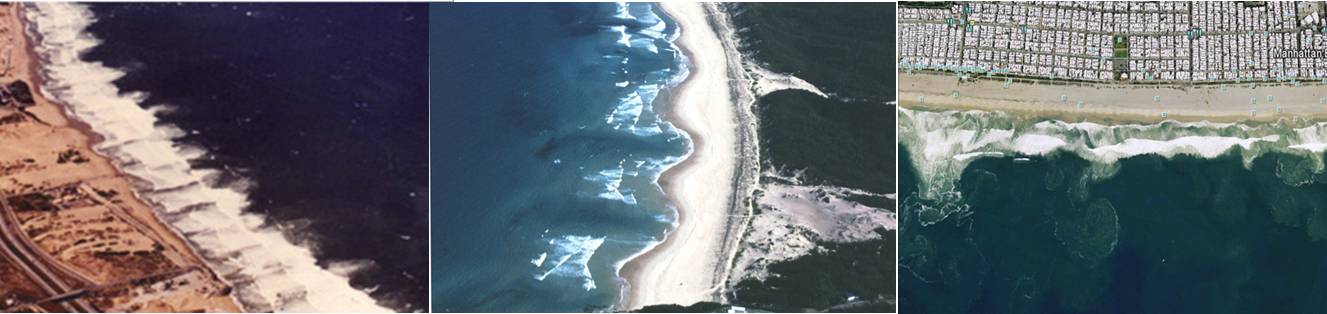
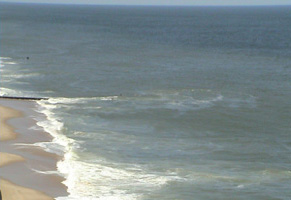
Firgure 1
 |
| Rip currents developed by bar trough channel flow |
|
Figure 2
 |
| A series of rip currents (~100m apart) |
|
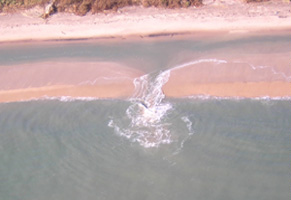
Figure 3
 |
| Flashing or intermittent rip currents |
|
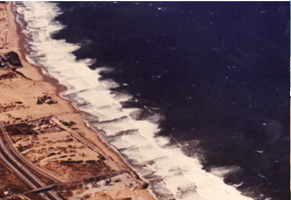
Figure 4
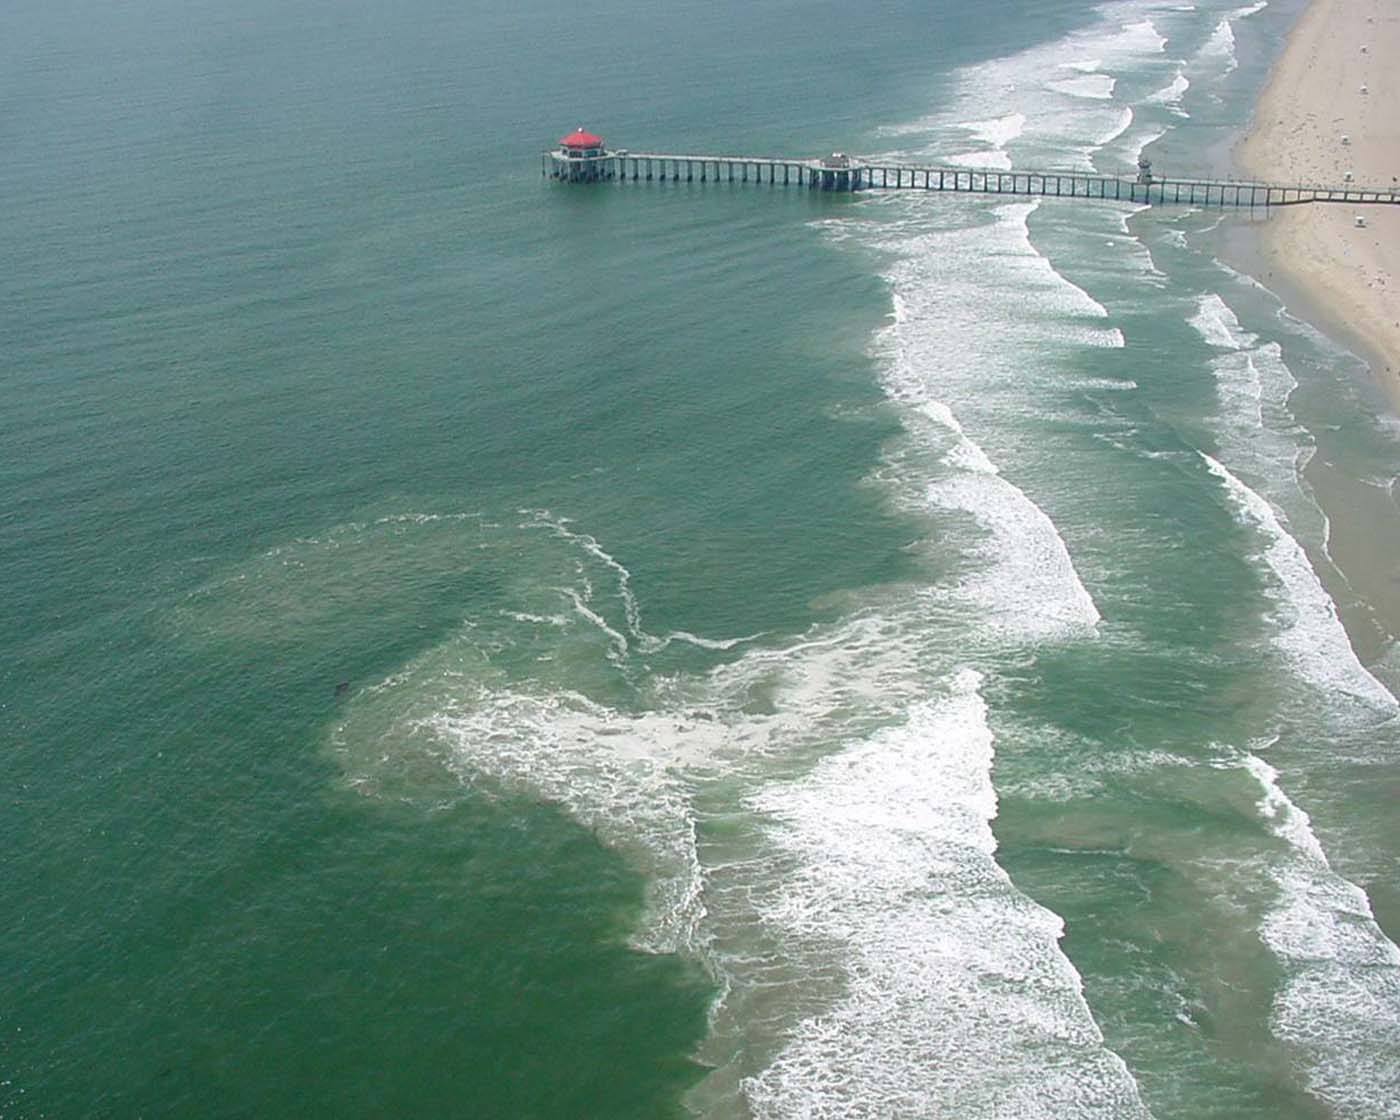 |
| Rip currents influenced by a near-structure |
|
Click here to see more images of rip currents.
Monitoring Rip Currents - Critical Factors in Determining the Risk
Field observations indicate risk rip currents are related to
the following factors:
-Waves (surf heights, period, direction)
-Beach (slope, orientation, sand material)
-Water levels (tidal cycle, tide ranges)
-Winds (on-shore winds)
-Other (shoreline configuration, promontories by natural or human made)
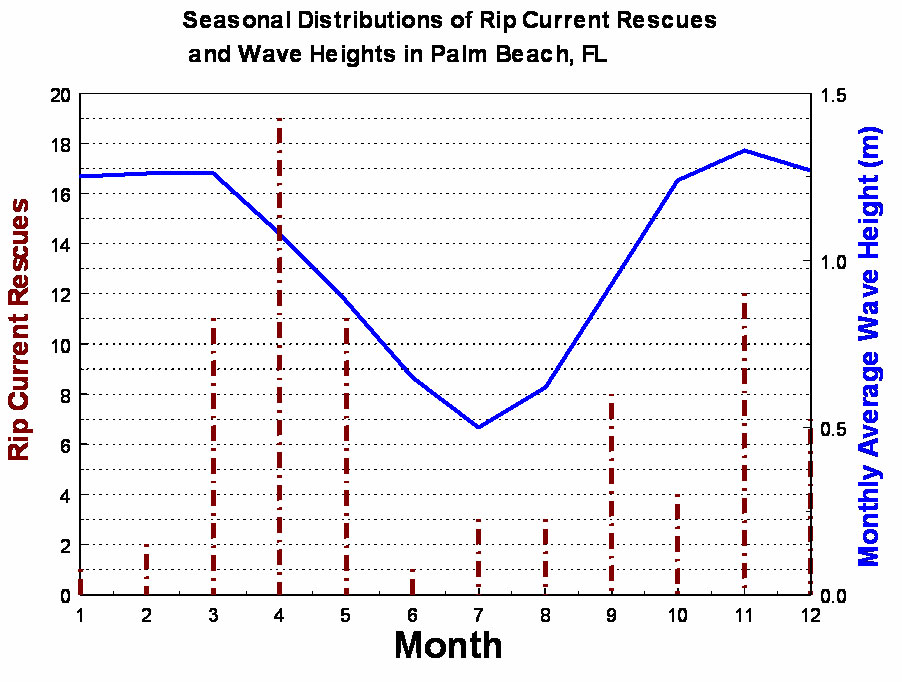
Highest scenarios of rip hazards are not high surfs but high exposure
of beach users during warm water in summer-fall period. When low energy, longer
period of waves (significant wave heights of 0.5 -1.5 meters in 10-15 sec sequence )
led to highest number of rip incidents. During spring/neap or daily very low tidal cycle,
a mass rescue event can cause 200s rescues in several places of a beach or several
beaches under the same conditions.
A rip threat risk index can reduce rip fatalities by Weather
Forecast Office working in collaboration with beach lifeguard safety teams. A short-term
warning and an outlook for 24 hours ahead will help ensure beach safety.
Rip Current Monitoring System
Rip Current Monitoring System - by U.S. lifeguards and coastal marine Weather Forecast Offices.
Placemarks in the map above show the location of lifeguard-supplied rip current observations. The National Oceanic and Atmospheric Administration
logo indicates a place where more than one beach is located. Zooming in using the map controls in the upper left will reveal the individual beaches.
Where paddle shaped placemarks are displayed, the color indicates the level of rip current activity (see legend below).
Clicking on the placemark will show the most recent rip current observation. To see
rip current observations for the past 5 days, click on the link in the placemark balloon.
Beaches with no recent observations are shown as a dot.
 |
Multiple Beaches |
 |
Low Activity |
 |
Medium Activity |
 |
High Activity |
 |
No Recent
Observations |
If you click on the hyperlinked beach names below you'll see 30 days of rip current observations.
You can view rip current observations for multiple beaches and for you're preferred time interval
using the Rip Current Observation Database page.
Non-hyperlinked beaches below represent future rip current monitoring system coverage.
| I. |
West Coast |
| |
A. Southern California |
Huntington Beach,
Manhattan Beach,
Mission Beach,
Moonlight Beach,
Newport Beach,
San Clemente Beach,
Torrey Pines State Park and
Zuma Beach
|
| |
B. Northern California |
Montara Beach and
Pacifica Beach |
| II. |
East Coast |
| |
A. East Florida |
Crescent,
Daytona,
Jacksonville and
Melbourne
|
| |
B. Mid-Atlantic |
Carolina Beach (NC),
Emerald Isle (NC),
Garden City Beach (SC),
Kill Devil Hills (NC),
Kure Beach (NC),
Long Beach (NJ),
Myrtle Beach (SC),
North Myrtle Beach (SC),
Ocean City (MD),
Outer Banks (NC),
Seaside Park (NJ),
Topsail Beach (NC), and
Wrightsville Beach (NC)
|
| |
C. New England |
Hampton (NH)
Hither Hills (Long Island, NY),
Jones (Long Island, NY),
Long Beach (Long Island, NY),
Ocean Beach (Long Island, NY),
Robert Moses (Long Island, NY), and
Smith's Point (Long Island, NY)
|
| III. |
Gulf of Mexico |
| |
A. West Florida |
San George Island
|
| |
B. Mid-Gulf |
Panama City (FL) and
Pensacola (FL)
|
| |
C. Texas |
Padre Island National Seashore,
Port Aransas, and
South Packery Channel Beach
|
| IV. |
Great Lakes |
| |
A. Lake Michigan |
Grand Haven (MI),
Indiana Dunes State Park (IN),
Marquette (WI),
New Buffalo City (MI),
Silver Beach (MI),
Warren Dunes State Park (MI),
Washington Park (MI), and
West Beach (IN),
|
| |
B. Lake Superior |
|
| |
C. Lake Erie |
|
| V. |
Hawaii |
| |
A. Oahu |
Waikiki |
| |
B. Hawaii |
|
Public Awareness Notes:
-Rip Current Deaths by State
-Beach types of prevalent rips or no rips
|


