Science and Technology Infusion Climate Bulletin
NOAAs National Weather Service
33rd NOAA Annual Climate Diagnostics and Prediction Workshop
Lincoln, NE, 20-24 October 2008
[Print
Version]
Towards a Global Drought Monitoring and Forecasting Capability
Lifeng Luo1, 2, Justin Sheffield1, Eric F. Wood1
1Environmental Engineering and Water Resources
Department of Civil and Environmental Engineering, Princeton University
2Program in Atmospheric and Oceanic Sciences, Princeton University
1. Introduction
Droughts are as much a part of weather and climate extremes as floods, hurricanes and tornadoes, but are the most costly extremes among all natural disasters in the U.S. [Ross and Lott, 2003]. The estimated annual direct losses to the U.S economy due to droughts are about $6$8 billion, with the drought of 1988 estimated to have damages over $39 billion [Federal Emergency Management Agency, 1995]. Over other parts of the world, droughts are also among the most damaging of natural disasters in human, environmental and economic terms. The consequences of drought are perhaps nowhere more urgent than in Africa where IPCC projections of increase future drought frequency have perilous implications for the livelihood of residents who depend heavily upon ecosystem services. Unlike other natural disasters, droughts develop slowly over large areas and over an extended period of time, making it difficult to identify them until they have become severe and some damage has already occurred. Therefore, accurate quantitative assessment of drought conditions and the prediction of the on-set, duration and recovery of droughts in realtime are critical for drought planning and preparedness.
Studies over the last two decades have demonstrated the feasibility of seasonal climate predictions with dynamical climate models. The skill of seasonal predictions is believed to come from the slow varying components of the climate system, mainly tropical Pacific sea surface temperature, although more recently surface soil moisture has also shown certain contributions over transition zones between dry and wet climatic regions (Koster et al. 2000 and 2004). At present, seasonal climate predictions are made routinely at several weather and climate prediction centers and research institutes, including the European Centre for Medium-range Weather Forecasting (ECMWF), and in the U.S. the National Centers for Environmental Prediction (NCEP). The predictions have shown significant skill over the tropics, while in the mid-latitudes their skill is improving, with some models showing skill comparable to the skill from statistical models (Saha et al. 2006). There is the expectation that these seasonal dynamical climate forecasts can contribute to the development of seasonal hydrologic prediction capabilities.
However, challenges must be overcome in utilizing seasonal climate forecasts from dynamical climate models in a seasonal hydrologic prediction system. One significant challenge is to correct the biases in climate model predictions, especially those related to precipitation and temperature. Another challenge is to resolve the disparity in spatial scales between the ones resolved in climate models and those needed for hydrologic applications. For instance, the current operational NCEP global coupled ocean-atmosphere model, called the Climate Forecast System (CFS) (Saha et al. 2006), runs at T62L64 resolution (~1.875 degree in longitude). The climate models in the European Union (EU) DEMETER project (Palmer et al. 2004) provide hindcasts at a resolution of 2.5°×2.5°. However the hydrologic predictions need atmospheric forcing at a much finer resolution. As an example, the North America Land Data Assimilation System (NLDAS) (Mitchell et al. 2004), which provides real-time hydrologic simulations across the continental U.S., has adopted a spatial scale of 1/8th degree. Such disparities require a seasonal hydrologic forecast system to spatially downscale the information provided by the climate models to the finer hydrologic scale where the information can be properly used. The third challenge is to create realistic daily atmospheric forcing for hydrologic modeling from the monthly information provided by the climate models. Climate model forecasts are generally only available as a monthly forecast while the hydrologic models are run at daily or sub-daily time steps. To make skillful seasonal hydrologic predictions, a good strategy is needed to overcome these challenges.
This report summarizes the current research activity by the Princeton Land Surface Hydrology Group on developing the capability to monitor and forecast drought in near realtime for the US and globally. Part of the system is currently in transition to EMC/NCEP for operational testing. In the next two sections, we briefly describe the methodology for the Drought Monitoring and Prediction System (DMAPS), and present examples of its implementation for the US and its pilot extension to Africa, followed by a brief summary.
2. Methodology
Figure 1 provides a schematic diagram of our current approach for drought monitoring and prediction over the U.S. The central element of DMAPS is the Variable Infiltration Capacity (VIC) hydrological model [Liang et al., 1996; Cherkauer et al., 2003] that transforms meteorological information into hydrological information such as soil moisture and streamflow. VIC is one of several state-of-the-art macroscale hydrological models available, and it has been calibrated and evaluated in numerous studies at grid, basin and continental scales [Nijssen et al., 1997; Cherkauer and Lettenmaier, 1999; Maurer et al., 2002; Roads et al., 2003; Nijssen et al., 2001; Sheffield and Wood, 2007].
For drought monitoring, the approach is to use the VIC model with realtime atmospheric forcing provided by the North American Land Data Assimilation System (NLDAS) [Mitchell et al., 2004] to estimate the current total column soil moisture at each 1/8 degree grid across the continental U.S. A drought index value is computed for each grid, where the index is expressed as a percentile value of the current soil moisture with respect to its climatological probability distribution [Sheffield et al., 2004a]. The climatological distribution at each grid was obtained by running the VIC model with an observational atmospheric forcing dataset [Maurer et al., 2002; Cosgrove et al., 2003] for the period of 19492004, then sampling daily soil moisture values from days that are within a 49-day sampling window centered on the current day of each year. This gives a reasonable representation of the modeled soil moisture climatology with over 2500 samples. Both the realtime NLDAS forcing and the historical forcing are observation based and their quality has been validated in several studies [Luo et al., 2003; Maurer et al., 2002]. The soil moisture values obtained from these simulations have been shown to accurately represent soil moisture dynamics [Robock et al., 2003; Maurer et al., 2002]. Because the soil moisture percentile-based drought index provides a quantitative measure as a spatially continuous field, it can be used in drought forecasting. As illustrated in Figure 2, the drought assessment from our index and those of the Climate Prediction Centers (CPC) Drought Monitor [Svoboda et al., 2002] are comparable (see http://hydrology.princeton.edu/forecast/). The major differences between the two are that CPCs drought monitor is somewhat subjective, since human analysts blend five key indicators and numerous supplementary indicators together to form a drought intensity map, and that CPCs drought monitor includes hydrologic drought which is defined as a low snowpack, streamflow or reservoir levels.
The drought prediction component of DMAPS utilizes the seasonal hydrologic prediction system described in detail by Luo and Wood [2008]. As the drought monitoring component provides the best estimate of hydrologic initial conditions for the forecast through observation-based spinup, the prediction component needs to properly address the uncertainties associated with the atmospheric forcing, which is the major contributor to the total uncertainty in seasonal hydrologic forecast. Thus the accuracy of the atmospheric forcings is essential to the skill of the hydrologic predictions. Due to the nature of the forecast problem, atmospheric forcings cannot be accurately predicted; instead, their uncertainties need to be accurately quantified via an ensemble approach. Our goal is to create an ensemble of atmospheric forcings that reflects our best estimate of future conditions and their uncertainties. As illustrated in Figure 1, to achieve this, the system implements a Bayesian merging procedure [Luo et al., 2007] to combine seasonal forecasts from dynamical climate models with observed climatology at the monthly level to obtain posterior distributions for monthly precipitation and temperature at each grid for each month of the forecast period. Figure 3 illustrates the use of the Bayesian merging technique to combine a SST forecast from one DEMETER climate model with observed climatology to achieve a better estimate of the posterior distribution. This process effectively removes biases in the climate model seasonal forecasts and statistically downscales the forecasts from climate model scales to the smaller scale that is more appropriate for hydrologic applications. When making seasonal hydrologic predictions at the beginning of each month, the system takes all the members from NCEPs CFS [Saha et al., 2006] seasonal forecast issued during the previous month and passes them through the Bayesian merging procedure to obtain the posterior distributions that are sampled to generate 20 atmospheric forcing ensembles for the hydrologic prediction. The 20 atmospheric forcing time series are based on 20 historical daily forcing time series from the dataset provided by Maurer et al. [2002] and adjusted at the daily level to match the monthly forecast values sampled from the posterior distribution. Half of the members are selected randomly from all available historical records and the other half are selected with a historical-analogue criterion. For the latter, all historical precipitation patterns are compared with the current predicted precipitation pattern (mean of the posterior distribution) and are sorted by their similarities to the current predicted pattern. The similarity is simply measured by the root mean square difference (RMSD) of the two, calculated for all grids in the region and all sixmonth periods. The likelihood of realization for each ensemble member is considered to be larger if its RMSD value is smaller. Therefore the 10 historical years with the smallest RMSD values are selected. Although simple and empirical, this selection criterion considers the similarity in spatial and temporal patterns in monthly precipitation anomalies. The small ensemble set formed by the seven members with largest likelihood of realization is noted as the most-likely ensemble set. As shown in the next section, using the CFS seasonal climate forecasts, the hydrological prediction with the most-likely ensemble set has shown promising skill in predicting recent droughts over the West and Southeast of the U.S.
3. Drought monitoring and forecasting over the US
The drought forecast system was tested initially with retrospective forecasts of selected historical drought events in the US. The successful prediction of the onset, development, and recovery of droughts is very valuable for drought impact preparation and mitigation. The summer of 1988 was very dry over the central northern part of United States. The severe drought conditions lasted more than five months, causing significant damages to agriculture and the local economy [American Meteorological Society 1997]. Here, we use the summer of 1988 forecasts for the Ohio River basin as an example to illustrate the skill of our prediction system (Figure 4). Results are shown for three different approaches (ESP, CFS, and CFS+DEMETER). The Ensemble Streamflow Prediction (ESP) forecast is a proxy of the forecast approach used operationally at river forecast centers (RFCs). The CFS-based forecast utilizes the information from seasonal climate forecast from the NCEP CFS in the Bayesian merging procedure, and the CFS+DEMETER forecast is the same as the CFS-based forecast except that it also uses forecast information from 7 DEMETER models, thus forming a multi-model Bayesian merging. As shown in Figure 4, at the beginning of May 1988 much of the region was already in drought, so all three approaches predicted dry soil moisture anomalies, as indicated by the low percentile values of the ensemble mean. However, the development of the drought is predicted differently by the three different approaches, mainly as a result of the difference in precipitation forecasts. The drought as predicted by CFS+DEMETER persists much longer (to the end of the forecast period), whereas the drought almost recovers in June according to the ESP forecast.
During early 2007, severe droughts developed over the west and southeast of the U.S. These events were captured by our monitoring system and well predicted by our prediction made from the initial conditions on January 1, 2007. Figure 5 compares the predicted soil moisture conditions from the most-likely ensemble set of the 200701 forecast with the observed soil moisture condition from our realtime drought monitoring. The prediction indicates a severe drought developing over California and the ensemble spread (expressed as the difference in percentile values of the lower and upper quartile of the ensemble distribution) is small suggesting a highly confident prediction over the region (see the contours of the inter-quartile range in the left hand portion of Figure 5). Over the Southeast, it is predicted that a relatively weaker drought condition develops in February and expands to the entire Southeast in March. However, the ensemble spread is large (>30), suggesting that less confidence should be given to the prediction. Compared with the soil moisture conditions from the drought monitoring, the prediction over the West gives a very good correspondence in terms of the area and severity of the drought with accuracy values (hit rate) of 0.93, 0.92 and 0.88 for predicting soil moisture below the 20th percentile over the region during the first three months, respectively. Over the Southeast, the prediction is satisfactory but slightly less skillful with accuracy values of 0.94, 0.54 and 0.44. It under-predicted the severity of the drought locally over Mississippi, Alabama and Tennessee, and over-predicted the severity for the East Coast. Since the ensemble spread is quite large over these regions, such forecast errors are not surprising.
To further evaluate the skill of the predictions, Figure 6 shows the evolution of the droughts and their predictions over the West and the Southeast defined by the boxes in Figure 5. Within each region, the number of 1/8 degree grid cells where the monthly mean soil moisture value is below the 20th percentile threshold is counted for each month. The black solid lines in Figure 6 are from the realtime drought monitoring and represent the actual development of the droughts. For the predictions, grid cells that satisfy the same criteria are counted in each of the seven ensemble members and the counts are averaged to give the mean forecasts (solid green, blue and red lines). The spread of each ensemble forecast is indicated by the thin lines as one standard deviation from their mean. Evidently, the predictions are very skillful in capturing the evolution of the droughts over both regions, especially during the first two months of each forecast. Since predictability decreases with lead time, as illustrated by Luo and Wood [2006], we expect that forecast skill will also decrease with lead time, which is supported by the increase in ensemble spread and with the mean forecasts approaching climatology. Therefore, when interpreting the prediction, we tend to trust the predictions more at the shorter lead times.
4. Towards a global drought monitoring and forecasting capability
These U.S. focused monitoring and prediction activities have provided the foundation for expansion to a global system. A first step towards this has been the development of an experimental system for Africa, the African Drought Monitor (ADM), developed jointly by Princeton University and the University of Washington, with support from UNESCOs International Hydrological Programme (IHP). This is now accessible at http://hydrology.princeton.edu/monitor. The ADM has the objective of providing near-real time (2-3 days latency) drought monitoring products based on VIC hydrologic output, and making these available for evaluation. Similar to the U.S. system (DMAPS), the ADM: i) provides near-real time fields of soil moisture and other hydrologic variables over Africa using observation-forced VIC simulations; ii) provides drought products that quantify the current state of drought in the context of the regional climatology; and iii) monitors where drought evolution and dissipation based on soil moisture thresholds.
The background climatology for drought assessment is based on long-term (1950-2000) global VIC land surface model simulations of terrestrial hydrology forced by the meteorological forcing dataset of Sheffield et al. [2006]. The bias corrected and downscaled forcings are applied at 1.0 degree latitude-longitude spatial resolution. The forcing data were constructed by combining a suite of global observation-based data sets with the NCEP/NCAR reanalysis [Kalnay et al, 1996]. Known biases in the reanalysis precipitation and near-surface meteorology are known to exert an erroneous effect on modeled land surface water and energy budgets [Maurer et al, 2001] and were corrected using observation-based precipitation, air temperature and downward solar radiation data. Corrections were also made to the rain day statistics of the reanalysis precipitation [Sheffield et al., 2004b], which have been found to exhibit a spurious wave-like pattern in high-latitude wintertime. Corrected reanalysis precipitation was disaggregated in space to 1.0 degree spatial resolution by statistical downscaling using relationships developed with the Global Precipitation Climatology Project (GPCP) daily product. Disaggregation in time from daily to 3-hourly was accomplished similarly, using the Tropical Rainfall Measuring Mission (TRMM) 3-hourly 3B42 data set. Other meteorological variables (downward short- and longwave, specific humidity, surface air pressure and wind speed) were downscaled in space with account for changes in elevation whilst maintaining inter-variable consistency. The hydrologic output and specifically the soil moisture from these retrospective simulations have been analyzed in terms of the occurrence and characteristics of drought [Sheffield and Wood, 2007] and their long-term trends and variability [Sheffield and Wood, 2008]. Figure 7 shows historic time series of the ADM Drought Index and area in drought for regions of Africa. Also shown are maps of monthly drought severity during these drought events.
For real-time monitoring, the availability of data provides real challenges, especially in data-sparse regions such as Africa. We therefore have to rely on data streams from various providers and locations, and thus use observations from several sources. At present, precipitation is taken from the Precipitation Estimation from Remotely Sensed Information using Artificial Neural Networks (PERSIANN) system. Surface air temperature and wind speed are gridded from Global Telecommunication System stations. Downward radiative fluxes and humidity are indexed to surface air temperature and its diurnal range. Backup meteorological data are taken from the NCEP Global Forecast System analysis fields when primary data are unavailable or fail quality control checks. Figure 8 shows current drought and hydrologic conditions at the time of writing from the ADM webpage. Inconsistencies between the 50-year model climatology and the near real-time data pose a major challenge. For instance, the PERSIANN satellite-based precipitation is generally higher than climatology which tends to bias the drought products. We are currently adding additional satellite-based real time precipitation streams (namely, the NCEP/CPC CMORPH product and NASAs TRMM TMPA-RT) that will give an indication of the uncertainty in the real time products. We are also working to extend our climatology period (currently to 2000) to provide a longer overlap period, and allow us to implement bias adjustment procedures.
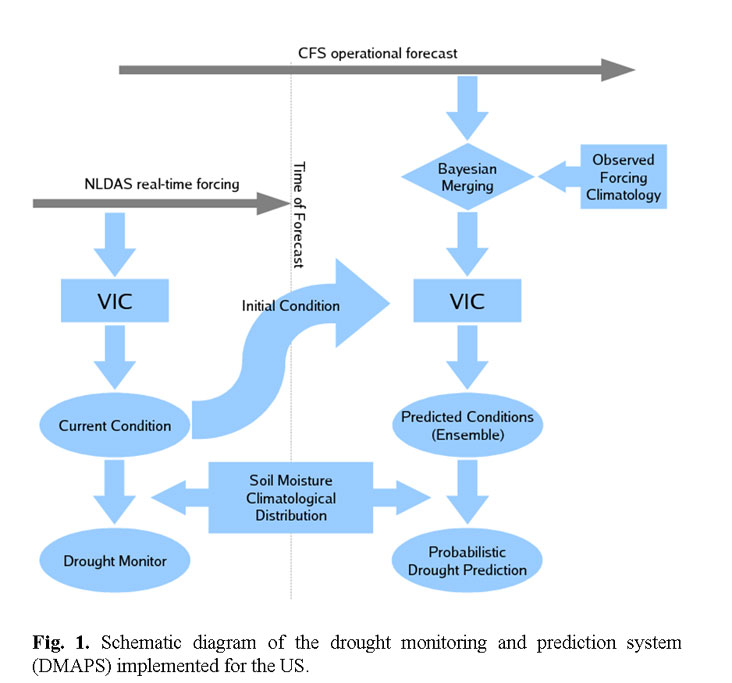
Figure 1
![]()
Figure 2

Figure 3

Figure 4

Figure 5

Figure 6
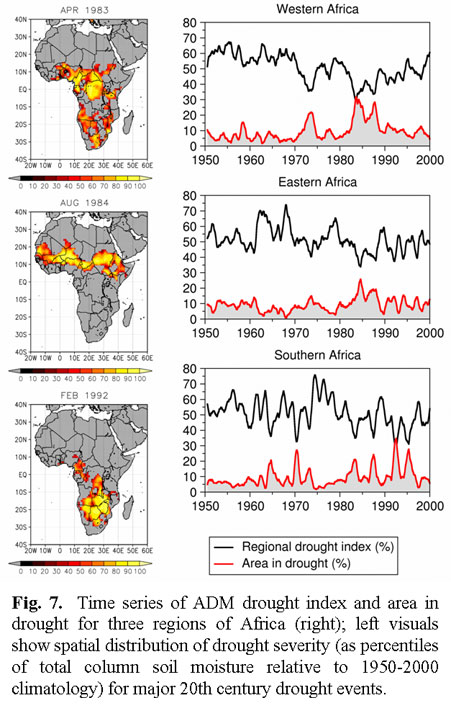
Figure 7
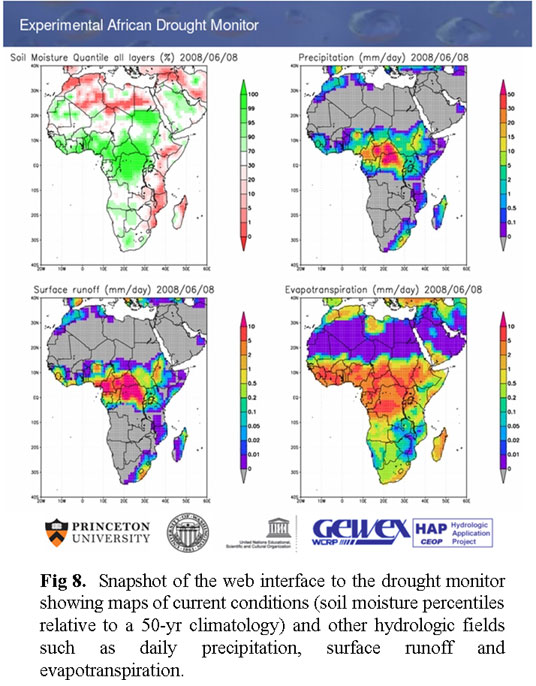
Figure 8
5. Summary
As shown in this study (including the results on our drought monitoring web site: http://hydrology.princeton.edu/forecast/ and http://hydrology.princeton.edu/monitor ), as well as by Sheffield et al. [2004a] and Andreadis and Lettenmaier [2006], model-based drought monitoring systems provide a reasonably accurate and quantitative measure of land surface hydrological conditions, when forced with high quality meteorological data. This study also demonstrates the feasibility of doing drought prediction using seasonal forecasts from dynamic climate models. Although forecasts from dynamic climate models have limited skill over the mid-latitudes in precipitation and temperature predictions, the drought prediction for the recent U.S. drought and hindcasts over the Ohio River basin [Luo and Wood, 2008] indicate the possibility of boosting forecast skill by statistically bias correcting and downscaling climate model forecasts via the Bayesian merging procedure. For the 2007 US drought, DMAPS was able to predict the onset of the severe drought over the West with great confidence (small ensemble spread) several months in advance, and the spatial pattern and severity of the predicted drought correspond well to the subsequent realtime drought monitoring of actual (modeled) conditions. In the Southeast, the system also predicted dry conditions, but the location, area and severity of the drought are not as accurate and the confidence is lower, as indicated by the spread of the ensemble distribution. This suggests that the ensemble spread is also informative when interpreting ensemble predictions.
Our current drought forecast system uses the ensemble seasonal forecast from CFS within the Bayesian merging procedure, but the system can potentially use forecasts from multiple models. As illustrated in this study and studies by Luo et al. [2007] and Luo and Wood [2008], a multi-model Bayesian merging produces more reliable and skillful forecasts as compared to forecasts from one single dynamic model. Our expected implementation of this procedure with seasonal forecasts from multiple seasonal climate models will further improve the accuracy of the drought recovery estimates and should help the development of the National Integrated Drought Information System (NIDIS).
Acknowledgments. This research was supported through NOAAs Climate Prediction Program for the Americas (CPPA) by Grant NA17RJ2612. This support is gratefully acknowledged.
REFERENCES
American Meteorological Society (1997): Meteorological drought. Bull. Am. Meteorol. Soc., 78, 847-849.
Andreadis, K. M., and D. P. Lettenmaier (2006): Trends in 20th century drought over the continental United States. Geophys. Res. Lett., 33, L10403, doi:10.1029/2006GL025711.
Cherkauer, K. A., L. C. Bowling and D. P. Lettenmaier (2003): Variable Infiltration Capacity (VIC) cold land process model updates. Global and Planetary Change, 38(1-2), 151-159.
Cherkauer, K. A., and D. P. Lettenmaier (1999): Hydrologic effects of frozen soils in the upper Mississippi River basin. J. Geophys. Res., 104, 19,59919,610.
Cosgrove, Brian A. et al. (2003): Realtime and retrospective forcing in the North American Land Data Assimilation Systems (NLDAS) project. J. Geophys. Res., 108 (D22), 8842, doi:10.1029/2002JD003118.
FEMA. (1995): National Mitigation Strategy; Partnerships for Building Safer Communities. Mitigation Directorate, p. 2. Federal Emergency Management Agency, Washington, D.C.
Koster, R. D., M. J. Suarez and M. Heiser (2000): Variance and predictability of precipitation at seasonal-to-interannual timescales. J. Hydrometeor., 1, 26-46.
Koster, R. D., M. J. Suarez, P. Liu, U. Jambor, A. Berg, M. Kistler, R. Reichle, M. Rodell and J. Famiglietti (2004): Realistic initialization of land surface states: impact on subseasonal forecast skill. J. Hydrometeor. 5, 1049-1063. doi:10.1175/JHM-387.1
Liang, X., E. F. Wood, and D. P. Lettenmaier (1996): Surface soil moisture parameterization of the VIC-2L model: Evaluation and modifications, Global Planet. Change, 13, 195-206.
Luo, L., et al. (2003): Validation of the North American Land Data Assimilation System (NLDAS) retrospective forcing over the southern Great Plains. J. Geophys. Res., 108(D22), 8843, doi:10.1029/2002JD003246.
Luo, L., and E. F. Wood (2007): Monitoring and predicting the 2007 U.S. drought. Geophys. Res. Lett., 34, L22702, doi:10.1029/2007GL031673.
Luo, L., E. F. Wood, and M. Pan (2007): Bayesian merging of multiple climate model forecasts for seasonal hydrological predictions. J. Geophys. Res., 112, D10102, doi:10.1029/2006JD007655.
Luo L., and E. F. Wood (2008): Use of Bayesian mering techniques in a multimodel seasonal hydrologic ensemble prediction system for the Eastern United States. J. Hydrometeorology, 9, 866-884.
Maurer, E.P., A.W. Wood, J.C. Adam, D.P. Lettenmaier, and B. Nijssen (2002): A long-term hydrologicly-based data set of land surface fluxes and states for the conterminous United States. J. Climate. 15, 3237-3251.
Mitchell, Kenneth E. et al. (2004): The Multi-institution North American Land Data Assimilation System (NLDAS): Utilizing multiple GCIP products and partners in a continental distributed hydrological modeling system. J. Geophys. Res., 109, D07S90, doi: 10.1029/2003JD003823.
Nijssen, B., D. P. Lettenmaier, X. Liang, S. W. Wetzel, and E. F. Wood (1997): Streamflow simulation for continental-scale river basins. Water Resour. Res., 33, 711724.
Nijssen, B., R. Schnur, and D. P. Lettenmaier (2001): Global retrospective estimation of soil moisture using the Variable Infiltration Capacity land surface model, 1980-1993. J. Climate, 14, 1790-1808.
Palmer, T. N. et al. (2004): Development of a European multimodel ensemble system for seasonal-to-interannual prediction (DEMETER). Bull. Amer. Meteor. Soc., 85, 853-872.
Roads, J., et al. (2003): GCIP water and energy budget synthesis (WEBS). J. Geophys. Res., 108(D16), 8609, doi:10.1029/2002JD002583.
Robock, A., K. Y. Vinnikov, G. Srinivasan, J. K. Entin, S. E. Hollinger, N. A. Speranskaya, S. Liu, and A. Namkhai (2000): The Global Soil Moisture Data Bank. Bull. Amer. Meteorol. Soc., 81, 1281-1299.
Ross, T., and N. Lott (2003): A climatology of 19802003 extreme weather and climate events. Tech. Rep. 2003-01, NOAA/NESDIS, Natl. Clim. Data Cent., Asheville, N. C.
Saha, S., S. Nadiga, C. Thiaw, J. Wang, W. Wang, Q. Zhang, H. M. van den Dool, H.-L. Pan, S. Moorthi, D. Behringer, D. Stokes, M. Pena, S. Lord, G. White, W. Ebisuzaki, P. Peng, P. Xie (2006): The NCEP Climate Forecast System. J. of Climate, 19, 3483-3517.
Sheffield, J., G. Goteti, F, Wen, E. F. Wood (2004a): A simulated soil moisture based drought analysis for the USA. J. Geophys. Res.-Atmos. 109 (D24): Art. No. D24108 Dec. 29 2004
Sheffield, J., A. D. Ziegler, E. F. Wood, and Y. Chen, (2004b): Correction of the high-latitude rain day anomaly in the NCEP/NCAR reanalysis for land surface hydrological modeling. J. Climate, 17, 3814-3828.
Sheffield, J., and E. F. Wood (2007): Characteristics of global and regional drought, 1950-2000: Analysis of soil moisture data from off-line simulation of the terrestrial hydrologic cycle. J. Geophys. Res., in press.
Svoboda, M., et al. (2002): The drought monitor. Bull. Am. Meteorol. Soc., 83, 11811190.
Contact Lifeng Luo