Progression of ENSO Forecasts for 2006-2007
Jim Kinter and Ben Kirtman [Print Version]
Center for Ocean-Land-Atmosphere Studies
George Mason University
As part of their routine experimental prediction activity, several research and operational groups produce real-time forecasts of El Niño and the Southern Oscillation (ENSO) each month. The models used to make these forecasts are both dynamical models (typically coupled general circulation models of the global atmosphere and world oceans) and statistical models based on the historical record of ENSO. The model-based real-time forecasts are compiled and archived (http://iri.columbia.edu/climate/ENSO/currentinfo/archive/index.html) by the International Research Institute for Climate and Society (IRI). One particularly widely-used index of ENSO is NINO3.4, which is the sea surface temperature (SST) anomaly averaged over part of the equatorial Pacific (5°S-5°N; 170°W-120°W). The IRI assembles a multi-model ensemble (each of which is an ensemble mean of multiple members for each forecast model) to produce a probabilistic prediction of NINO3.4 at up to one-year lead (http://iri.columbia.edu/climate/ENSO/currentinfo/figure3.html). The prediction is made for each of three categories (El Niño, neutral and La Niña) that are the tercile ranges of NINO3.4, based on the historical record of SST. More information about how the probabilistic forecast is made is available from the IRI.
The NINO3.4 prediction plume a graphical representation of the distribution of model-based forecasts at each lead as well as the probabilistic tercile forecasts are included in the suite of tools that are used each month by the National Oceanic and Atmospheric Administration Climate Prediction Center (CPC) to formulate the official climate outlooks that are issued to the public. The CPC involves representatives of the research groups that contribute information and tools to the suite in a monthly conference call to formulate the outlooks. A lively series of email exchanges among the participants on the conference calls on the topic of the forecasts made for the boreal winter of 2006-2007 suggested that the current state of the art of ENSO prediction is relatively primitive and inadequate. The purpose of this note is to document the progression of real-time forecast distributions as they evolved in advance of the 2006-2007 ENSO event.
Figure 1 shows the distributions estimated from the forecasts available on the IRI archive at various lead times. In each case, all forecasts verifying in the seasons November 2006 January 2007 (NDJ), December 2006 February 2007 (DJF), and January 2007 March 2007 (JFM) were pooled to obtain a robust sample to estimate the distribution. The pool included ~40-50 forecasts at each lead-time. No attempt was made to weight the forecasts based on prior information (e.g. skill in hindcasts), i.e., all forecasts were given equal weight in estimating the distribution. A kernel estimator technique (Silverman 1986) was used to estimate the distributions, with 1001 bins in each distribution.
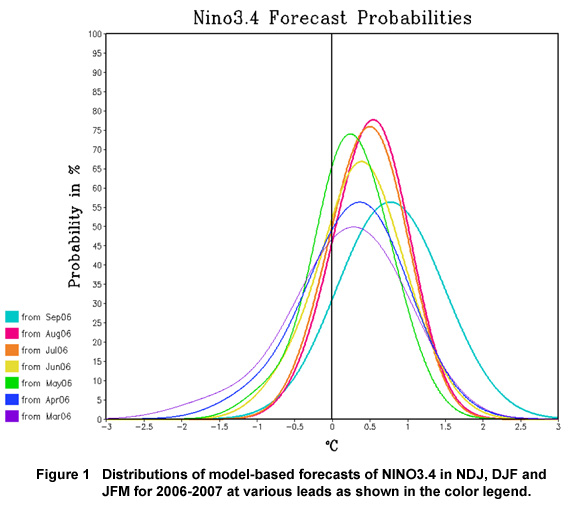
Figure 1
As is apparent from Fig. 1, the forecasts underwent a clear progression from the longest to the shortest leads. The earliest forecasts (made in March and April 2006) have broad distributions with mean anomalies of less than +0.5°C and non-negligible probabilities of below-normal NINO3.4 values. With each subsequent forecast, the probability of below-normal NINO3.4 values diminished. The forecasts made in and after July 2006 had a markedly larger mean anomaly of NINO3.4 (+0.6°C) and substantially less probably of below-normal values. The forecasts made in September and October 2006 showed even higher mean anomaly values (+0.8°C) and, again, diminished probability of below-normal values. Interestingly, the latter forecasts have broader distributions than those made in July and August 2006, primarily because of a systematic disagreement between the dynamical models that typically had relatively high values of NINO3.4 and the statistical models that had relatively low values. Table 1 shows an excerpt of the distribution for the forecasts made in September 2006 and October 2006 that illustrates this disagreement.
September 2006 Forecasts |
NINO3.4 ≤ 0.5°C |
NINO3.4 ≥ 1.0°C |
||
|
Dynamical models (32 members) |
6 |
19% |
12 |
38% |
|
Statistical models (24 members) |
9 |
38% |
5 |
21% |
October 2006 Forecasts |
NINO3.4 ≤ 0.7°C |
NINO3.4 ≥ 1.2°C |
||
|
Dynamical models (34 members) |
7 |
20% |
13 |
38% |
|
Statistical models (24 members) |
9 |
38% |
6 |
25% |
Table 1 Number of forecasts verifying in November 2006, December 2006 or January 2007 made in September 2006 and October 2006 in each of two categories: NINO3.4 ≤ 0.5°C and NINO3.4 ≥ 1.0°C.
The progression of ENSO forecasts made for the 2006-2007 event is completely consistent with the current state of understanding of ENSO prediction. ENSO forecasts made for the boreal winter season at longer leads tend to be distributed more broadly, illustrating the relatively low confidence and the effect of the so-called spring predictability barrier when the coupling between the ocean and atmosphere in the tropical Pacific is weakest. As lead times decrease, forecast distributions become narrower and the amplitude of the predicted anomaly, in the case of forecasts of either warm or cold ENSO events, increases. Furthermore, the relative pessimism expressed in the email discussion of real-time forecasts was unnecessarily harsh: the distribution of model forecasts made in July 2006 (two seasons lead) was indicative of a warm ENSO event of moderate magnitude (mean anomaly of +1s), and the forecasts made in August, September and October remained fairly consistent with the July distribution. It should be noted that mixing forecasts from dynamical and statistical models with equal weights tended to broaden the distribution when the models from the two different classes disagreed systematically. It will remain to be seen how well this set of forecasts verifies in the coming months.
Acknowledgements
The data used in this study were made available by the IRI. Special thanks are extended to Tony Barnston and Shuhua Li of the IRI for providing some of these data in advance of the official posting on the IRI web site.
References
Silverman, B. W., 1986: Density Estimation for Statistics and Data Analysis. Chapman and Hall. 195 pp.
Contact Jim Kinter