US National Oceanic and Atmospheric Administration
Climate Test Bed Joint Seminar Series
NCEP, Camp Springs, Maryland, 10 December 2008
[Print
Version]
Subseasonal Variability of Hurricane Activity
Kathy Pegion1*, Philip Pegion2*, Tim DelSole1, and Mihai Sirbu1
1Center for Ocean-Land-Atmosphere Studies, Calverton, Maryland
2Climate Prediction Center, Camp Springs, Maryland
*Current Affiliation: NOAA/ESRL/PSD, CIRES Climate Diagnostics Center, Boulder, Colorado
1. Introduction
Several studies have suggested a relationship between tropical cyclone activity in the eastern Pacific and Atlantic basins and the Madden-Julian Oscillation (MJO; Maloney and Hartmann 2000a,b; Higgins and Shi 2001). This relationship is attributed to the ability of the MJO to impact the atmospheric circulation, making the large-scale environment more or less favorable for tropical cyclone development. In two separate studies, Maloney and Hartmann (2000a,b) find a strong relationship between the MJO and tropical cyclone activity in the eastern Pacific, Gulf of Mexico, and Caribbean. They found that tropical cyclone activity is increased significantly in these regions when the MJO-related convection is in the Indian Ocean and associated westerly low-level wind anomalies are present across the eastern equatorial Pacific. These anomalous winds set up a region of large-scale cyclonic low-level vorticity and reduced wind shear over these regions, two conditions that are favorable for the development of tropical cyclones. The opposite conditions exist when MJO-related convection is located over the western equatorial Pacific and associated easterly anomalies in low-level winds are present over the eastern equatorial Pacific resulting in less favorable conditions for tropical cyclone development.
A study by Higgins and Shi (2001) investigates the variability of Northern Hemisphere warm season precipitation and corresponding large-scale circulation in the CPC merged analysis of precipitation and NCEP/NCAR Reanalysis data. In this study, they find that there is evidence that the MJO modulates tropical cyclone activity by collocating tropical storm and hurricane origination points during the peak months of the Atlantic hurricane season (JAS) with 200 hPa velocity potential composited by MJO phase. This analysis indicates that the strongest tropical cyclones tend to form when the MJO favors enhanced precipitation in that region. This is characterized by large-scale divergence associated with large-scale ascent.
These studies indicate that the MJO impacts the large-scale circulation, making the environment more or less favorable for the development of tropical cyclones on subseasonal timescales, specifically in terms of the dynamics (i.e. low-level vorticity and vertical wind shear). In the current study, we further investigate this relationship by using a commonly used index of MJO activity and indices that quantify whether the environment is favorable or unfavorable for tropical cyclone activity. Furthermore, we quantify this relationship using the technique of mutual information. Additionally, we investigate whether the NCEP operational climate model can capture the observed relationship and offer implications for prediction of tropical cyclone activity on subseasonal timescales.
2. Data and indices
a) MJO index
The all season real-time multivariate MJO (RMM) index of Wheeler and Hendon (2004) is used as a measure of MJO activity. These data were obtained from the Bureau of Meteorological Research Centre website and are available for the dates June 6, 1974 - December 31, 2007. The index is based on combined EOFs of equatorial zonal wind at 200 hPa, zonal wind at 850 hPa, and outgoing longwave radiation. These data are limited by the extent of the OLR data from the NOAA AVHRR satellite. We use the version of the index in which the interannual variability related to ENSO has been removed. The first two principal component timeseries (hereafter referred to as RMM1 and RMM2) are in quadrature and together represent a measure of MJO both in terms of phase and amplitude.
b) Hurricane indices
Two indices are used to represent hurricane activity: the seasonal genesis parameter (SGP; Gray 1979) and the genesis potential index (GPI; Emanual and Nolan 2004). These indices were originally designed to represent the large-scale, climatological locations favorable for tropical cyclone development. However, it is reasonable to assume that they are capable of representing large-scale regions where hurricane activity is favorable on other timescales provided the data used contains the necessary variability. Here, we apply the SGP and GPI to subseasonal variability of hurricane activity by calculating both indices using daily data from NCEP/NCAR Reanalysis (R2) for the years 1979-2007.
The SGP is the product of low-level (925hPa) absolute vorticity, inverse of the shear between 925 hPa and 200 hPa, relative humidity between 700 hPa and 500 hPa, moist stability in the layer between 1000 hPa and 500 hPa, and thermal energy in the layer between the surface and 60 meters based on a threshold temperature of 26 degrees C. The climatological values of SGP are calculated for the Atlantic and eastern Pacific and averaged over the hurricane season of June through November (Figure 1a). The actual initiation points of tropical storms formed based on the best track hurricane database for the years 1974-2007 are also shown (Figure 1e). The climatological SGP shows the well-known climatologically favored regions for tropical cyclone development. For example, the larger values of SGP indicate that the eastern Pacific along the coast of Central America is the most favored region for tropical cyclones to develop. This is consistent with the actual formation of tropical cyclones seen in Figure 1e. Additionally, the region referred to as the main development region (MDR) in the Atlantic is also apparent and consistent with the tropical storm formation in the eastern Atlantic. It is also apparent that the Caribbean, Gulf of Mexico, southeastern coast of the United States, and Pacific out to the dateline are climatologically favored regions for tropical cyclone development based on both the SGP and the historical tropical cyclone formations. The standard deviation of SGP (Figure 1c) shows that the regions of highest SGP are also the regions with the largest variability. The GPI is the product of low-level (850 hPa) absolute vorticity, relative humidity at 700 hPa, shear between 200 hPa and 850 hPa, and the potential wind intensity that could be obtained if a tropical system developed. The details of the calculation of potential intensity can found in Emanual and Nolan (2004). The potential intensity combines much of the same information contained in the ocean thermal energy and moisture stability terms in the SGP, but avoids the need to use a fixed threshold value for temperature. The climatological values of GPI and its standard deviation are calculated and averaged over the hurricane season (Figure 1b,d). The climatologically favored regions for tropical cyclone development are consistent with those calculated by SGP and by historical development including the dominance of the eastern Pacific, the MDR in the Atlantic, the Gulf of Mexico and east coast of the United States. The standard deviation again shows that the regions with the largest mean also have the largest variability. The most obvious difference between SGP and GPI are the non-zero values of GPI that extend from 30°N to 50°N in both basins. These differences are due primarily to the 26°C threshold in temperature used in the SGP calculation since SSTs are typically colder than 26°C this far north, the SGP is zero in these regions.
3. Observed relationship between the MJO and hurricane activity
In this section, we investigate this relationship using the SGP and GPI indices calculated from Reanalysis and compare with historical hurricane activity. Specifically, we attempt to quantify the relationship between the MJO and tropical cyclone activity in terms of the hurricane indices in order to assess some implications for using the MJO to predict periods of increased or decreased probability of tropical cyclone activity.
In order to provide a reference for identifying the phase of the MJO and the relationship with hurricane activity, we first calculate composite MJO events by phase for the observed NOAA/AVHRR OLR during the Atlantic hurricane season (Jun-Nov). First, a five-day running mean is applied to the OLR data to remove short timescale weather variations. Then, the anomalies are determined by removing an average annual and semi-annual cycle. A MJO event is determined to occur when the amplitude of RMM1 and RMM2 is greater than one. The anomalous OLR is averaged for each phase of the MJO to calculate a composite MJO event (Figure 2a). In phase one, enhanced convection indicated by negative OLR anomalies are present over the Western Hemisphere and off the coast of Africa in the westernmost part of the Indian Ocean. The anomalies propagate eastward and increase in amplitude in the Indian Ocean during phases two and three, then across the Maritime Continent during phases four and five. In phases six, the convection moves into the western Pacific Ocean, then north and eastward in phase seven. By phase eight, the convection is located over central America. The corresponding region of suppressed convection is also present and propagates eastward ahead of the region of enhanced convection. It is also important to point out the convective anomalies near the Americas associated with the MJO. For example, phases 1 and 8 have enhanced convective anomalies in this region while phases 4 and 5 have suppressed convective anomalies in this region.
We now assess the SGP and GPI indices by MJO phase in both the Atlantic and eastern Pacific in order to understand the relationship between the MJO and tropical cyclone activity. SGP and GPI are both calculated using full fields that have had a 5-day running mean applied. Additionally, the linear regression with Nino 3.4 has also been removed in order to remove the impacts of ENSO on the calculations. The anomalous SGP and GPI are determined by removing the average combined annual and semi-annual cycle for the years 1979-2007. The composite anomalies of SGP and GPI are calculated over the eight MJO phases for the months of Jun-Nov (Figure 3). Positive (negative) values indicate that the region is more (less) favorable for development of tropical cyclones. Both the SGP and GPI appear to have a strong signal based on MJO phase in the eastern Pacific and Caribbean and a weaker signal in the eastern Atlantic.
Apparently, conditions are more (less) favorable for development during phases eight, one, and two (three, four, five, and six) in the eastern Pacific and Caribbean. It is also apparent that the relationship between the MJO and the conditions for hurricane activity in the eastern Pacific is consistent with the relationship in the Caribbean and Gulf of Mexico. These results are consistent with those of Maloney and Hartmann (2000a,b). The historical development of tropical storms is also shown (green diamonds). These data are generally consistent with the SGP and GPI regions of more or less favorable conditions based on MJO phase with the exception of some regions of negative SGP and GPI anomalies in the eastern Pacific in phases three, four, and five. Perhaps these regions are strongly climatologically favored and the anomalies associated with the MJO have little impact.
Next, we quantify this relationship using the method of mutual information. The mutual information between a hurricane index and the MJO index is calculated as a measure of the null hypothesis that the hurricane index and the MJO index are independent. The formula for the calculation is given as:
![]()
If the hurricane index and the MJO index are independent, then the mutual information between the two will be zero. The RMM MJO index consists of eight MJO phases and a null phase for a total of nine possible phases. The hurricane indices are divided into terciles. Therefore, the summation in the calculation of mutual information occurs over twenty-seven possible cases. The mutual information between the SGP and the MJO index are shown in Figure 4 (top) and for GPI and the MJO index in Figure 5 (top). For the SGP, the largest values for the mutual information are located in the eastern Pacific. This is consistent with the changing values of SGP by MJO phase in the composites in this region. For the GPI, the values are almost constant throughout the region. It is surprising that the mutual information values are so different for the GPI compare to the SGP considering that the composites are very similar for the two. To determine if the value calculated for the mutual information is statistically significant from zero, the mutual information is recalculated with the joint probability between the hurricane index and the MJO index calculated by taking a different, random year for the hurricane index. This calculation is performed one-thousand times and the values are ordered. The 95th percentile for the mutual information is shown in Figure 4 (middle panels). Where the value for the mutual information exceeds the 95th percentile, it is considered to be statistically significant from zero and the null hypothesis can be rejected (Figure 4, bottom panels). Clearly for SGP, the mutual information values are significant in the eastern Pacific. For GPI, significant values are found throughout the region, but there is little spatial structure present.
4. Simulation of the relationship between MJO and hurricane activity in the CFS
The ability of the NCEP operational climate model to simulate the relationship between MJO and tropical cyclone activity is also investigated. Here, we compare composites of SGP and GPI from the CFS with those from the reanalysis products discussed in section 3 and calculate the mutual information between the hurricane indices and the MJO to see if the model captures the observed relationship.
a) Model description
The CFS is the fully coupled atmosphere-ocean general circulation model used operationally by NCEP for climate forecasts. It is composed of the NCEP Global Forecast System 2003 (GFS) as the atmospheric component and the Geophysical Fluid Dynamics Laboratory (GFDL) Modular Ocean Model version 3 (MOM3; Pacanowski and Griffies 1998) as the oceanic component. The version of the GFS used in this study has a resolution of T62 in the horizontal and 64 layers in the vertical. The ocean model has a quasiglobal domain ranging from 74°S to 64°N latitude. It has 40 layers in the vertical and a resolution of 1/3°x1° in the tropics and 1°x1° in the extratropics. The atmosphere and ocean exchange fluxes and sea surface temperatures once per day without flux correction. The sea ice extent is taken as climatology. For a more detailed description of this version of the CFS, see Saha et al. (2006) and Wang et al. (2005).
Since the model is relatively coarse resolution, there is no expectation that the model could accurately develop hurricanes. Therefore, we use the SGP and GPI indices as indicators of when the model simulates conditions that are favorable for the development of tropical cyclones. The RMM index, SGP and GPI are calculated using daily data from a 52-year, freely coupled simulation of the CFS. The simulation is initialized on Jan 1, 1985, and run for 52 years. The initial conditions for the atmosphere are from the NCEP Reanalysis-2. The ocean is initialized from the Global Ocean Data Assimilation System (GODAS).
b) Simulation of the MJO by the CFS
The simulation of the MJO by the CFS has been assessed extensively in Pegion and Kirtman 2008. They found that the model is generally able to simulate regions of enhanced and suppressed convective anomalies and the eastward propagation. However, the model has difficulty with the exact locations of the maximum and minimum anomalies, tends to be too strong, and propagates the anomalies slower than observed. Here, we summarize the simulation and emphasize the associated enhanced and suppressed convective anomalies in the eastern Pacific and Atlantic basins.
The RMM MJO index has been calculated for the 52-year CFS simulation following the same method as Wheeler and Hendon (2004). Composite OLR anomalies by the model MJO phase are shown in Figure 2b. Consistent with the results of Pegion and Kirtman 2008, large-scale OLR anomalies propagate eastward from the Indian Ocean and out to the dateline. Strong anomalies are also apparent in the eastern Pacific, off the coast of Mexico and Central America. These anomalies are generally much stronger than those from the observations and the phasing appears to be off somewhat in the CFS. Despite the deficiencies in the simulation, the CFS is able to capture the overall features of the OLR associated with the MJO. Therefore, it is possible that the model can simulate the relationship between the MJO and the hurricane indices.
c) SGP and GPI
The hurricanes indices, SGP and GPI, have been calculated for the CFS simulation using the same method described in section 2. The climatological values of SGP and GPI for the CFS (not shown) have patterns generally consistent with those calculated from R2 and with the historical locations of tropical cyclone formations; however the CFS is generally too strong. The standard deviations (not shown) for both indices are also consistent in pattern, but too strong compared to R2.
Composites of SGP and GPI are also calculated by model MJO phase (Figure 6). The model composites are consistent with the composites calculated using R2 (Figure 3) and ERA40 (not shown). For example, the SGP and GPI indices are positive in the Caribbean and Gulf of Mexico regions during phases eight, one, and two and generally negative in these regions during phases four and five. The SGP and GPI values are generally larger in the CFS than in R2.
Furthermore, we also calculate the mutual information between the hurricane indices and the MJO in the model following the same method described previously. The mutual information between the MJO index and the hurricane indices along with the 95th percentile calculations of the mutual information are shown in Figures 7 and 8. The mutual information between SGP and MJO index and GPI and MJO index are significantly different from zero in the eastern Pacific region. This indicates that the model is able to capture the observed relationship, but that a significant relationship is only present in the eastern Pacific. This is somewhat disappointing considering that there also appeared to be a relationship in the Gulf of Mexico region as well. Future work will assess whether these indices should be modified to be more appropriate for subseasonal timescales.

Figure 1

Figure 2

Figure 3

Figure 4
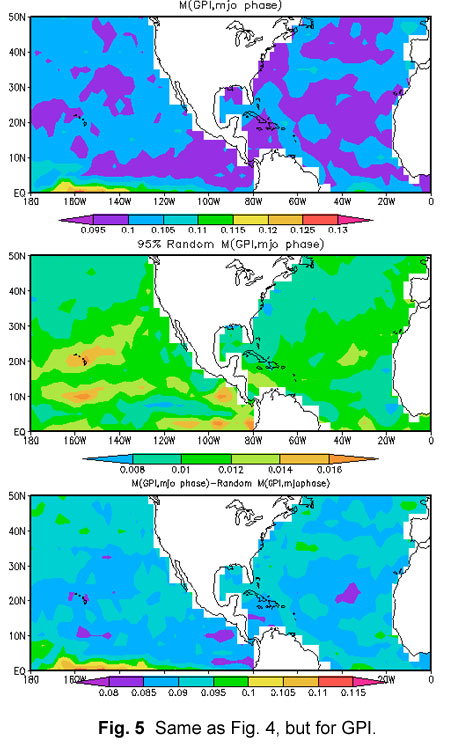
Figure 5

Figure 6

Figure 7
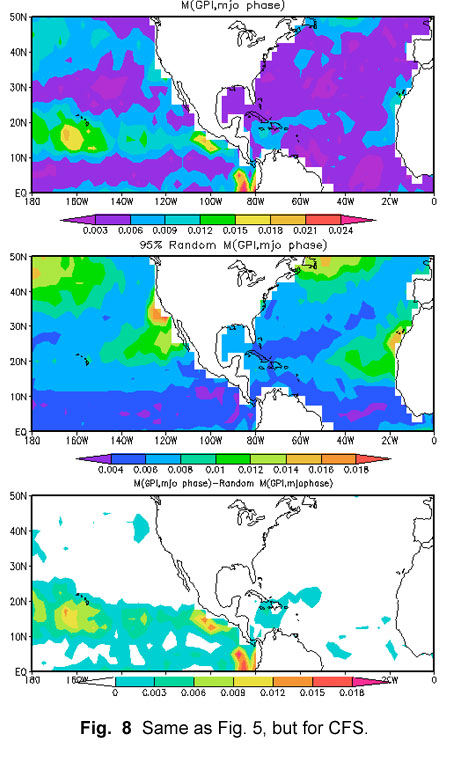
Figure 8
5. Summary and implications for subseasonal forecasts of tropical cyclone activity
The relationship between the MJO and tropical cyclone activity is assessed in terms of the ability of the MJO to change the large-scale environment, making it more or less favorable for tropical cyclone development. This relationship is assessed using two hurricane indices that have traditionally been used to for seasonal and climatological tropical cyclone development. Additionally, we have used these indices to assess whether the NCEP operational climate model can capture this relationship. We use the method of mutual information to quantify whether there is a relationship. Our results indicate that there is a statistically significant relationship in the eastern Pacific. Future work will attempt to determine if an index more appropriate for subseasonal variability can be determined. Furthermore, this work only quantifies the relationship between the hurricane indices and MJO. A relationship between the MJO index or the hurricane indices with tropical cyclones has not yet been established and is the subject of future work.
Because of the slowly evolving nature of the MJO, the composites of SGP and GPI may be useful for prediction purposes, specifically in the eastern Pacific where a statistically significant relationship between the hurricane indices and MJO index has been found. If it is known that the MJO is active and what phase it is in, the fact that it propagates eastward slowly allows these composites to be used to make forecasts for the next couple of phases. This kind of forecasting is already being used at the Climate Prediction Center to make forecasts on one to two week timescales as part of the Global Tropical Hazards product. However, since these composites only represent some averaged common behavior of the SGP and GPI related to the MJO and do not contain the interaction with other types of variability, it would be ideal to be able to use dynamical models to make actual forecasts of SGP and GPI. This work has established that the CFS is able to simulate the observed relationship between the hurricane indices and the MJO index relationship. Future work will assess its skill in forecasting these indices.
References
Emanuel, Kerry A., and David S. Nolan, 2004: Tropical cyclone activity and the global climate system. Preprints, 26th AMS Conference on Hurricanes and Tropical Meteorology, Miami Beach, May, 2004.
Gray, W.M., 1979: Hurricanes: Their formation, structure and likely role in the general circulation. Meteorology over the Tropical Oceans. Royal Meteorological Society, 155−218.
Higgins, R. W., and W. Shi, 2001: Intercomparison of the principal modes of interannual and intraseasonal variability of the North American monsoon system. J. Climate, 14, 403-417.
Maloney, E. D., and D. L. Hartmann, 2000a: Modulation of hurricane activity in the Gulf of Mexico by the Madden-Julian Oscillation. Science, 287, 2002-2004.
Maloney, E. D. and D. L. Hartmann, 2000b: Modulation of eastern North Pacific hurricanes by the Madden-Julian Oscillation. J. Climate, 13, 1451-1460.
Pacanowski, R. C, and S. M. Griffies, 1998: MOM3 manual, NOAA/Geophysical Fluid Dynamics Laboratory, Princeton, USA, 08542.
Pegion, K., and B. P. Kirtman, 2008: The impact of air-sea interactions on the simulation of tropical intraseasonal variability. J. Climate, 21, 616-6635.
Saha, S., S. Nadiga, C. Thiaw, J. Wang, W. Wang, Q. Zhang, D. Behringer, W. Ebisuzaki, S. Lord, S. Moorthi, H. L. Pan, P. Peng, D. Stokes, H. M. van den Dool, G. White, P. Xie, 2006: The NCEP Climate Forecast System. J. Climate, 19, 2483- 3516.
Wang W, Saha S, Pan HL, Nadiga S, White G, 2005: Simulation of ENSO in the new NCEP coupled forecast system model (CFS03). Mon. Wea. Rev., 133, 15741593.
Wheeler, M. C., and H. H. Hendon, 2004: An all-season real-time multivariate MJO index: Development of an index for monitoring and prediction. Mon. Wea. Rev., 132, 1917-1932.
Contact Kathy Pegion