US National Oceanic and Atmospheric Administration
Climate Test Bed Joint Seminar Series (2009-2010)
NCEP, Camp Springs, Maryland, 31 March 2010
[Print
Version]
Predictability of Monsoons in CFS
V. Krishnamurthy
Center for Ocean-Land-Atmosphere Studies, Calverton, Maryland
Department of Atmospheric, Ocean and Earth Sciences, George Mason University, Fairfax, VA
1. Introduction
It has been recognized that ocean-atmosphere interactions in the monsoon region is important and that coupled general circulation models (GCMs) are more appropriate for better simulation of the monsoon rainfall. For operational seasonal forecasts, the National Centers for Environmental Prediction (NCEP) of the United States has been using the Climate Forecast System (CFS), a fully coupled model, since 2004 (Saha et al. 2006). The forecast skill and the predictability of the CFS at daily and intraseasonal time scales for the South Asian and South American monsoon regions are assessed in this study. The dependence of the predictability of the South Asian monsoon on different phases of the active or break cycle of the monsoon is investigated. In the case of the South American monsoon, the daily rainfall variability is decomposed into modes of different timescales using a data adaptive method. Whether there is enhanced predictability in any of these modes of the South American monsoon is examined.
This study is based on the nine-month long retrospective forecasts generated by NCEP using the CFS. Daily forecasts starting from a 15-member ensemble of initial conditions each month are available for the period 1981-2005. These ensemble members are integrated from 15 different atmospheric initial states between 9th of the month and 3rd of the following month and three pentad ocean initial conditions centered at 11th, 21st of the month and the first day of the following month. The initial states of the ensemble starting in the period 9 April 3 May will be referred to as May initial conditions and forecasts of this ensemble as May forecasts. Similar naming convection is used for other months. For verification, the daily NCEP-Department of Energy Reanalysis-2 (R2) data and the daily high resolution gridded rainfall data from the India Meteorological department (IMD) have been used.
A major part of the analysis to assess the predictability of the CFS and to estimate the error growth rate follows the method used by Lorenz (1982). Forecast error is the difference between the forecast and observation while the predictability error is the difference between two forecasts made by the same model. The forecast error includes the error due to the uncertainty in the initial state as well as the error due to the model imperfection. A one-day forecast can be considered as a small perturbation over the observation (or analysis) for the given day. The predictability error can then be computed as the difference between two forecasts initiated one day apart. Similarly, the differences between forecasts initiated two days apart, and so on, will provide the growth of initial errors of different magnitude. The growth rate of small errors is determined by using Lorenzs empirical formula for nonlinear error growth (Lorenz 1982).
2. Predictability of South Asian monsoon
The June-September (JJAS) seasonal climatology of precipitation over the South Asian monsoon region is fairly well simulated but with overestimation over the west coast of India and the Bay of Bengal. The 850 hPa horizontal wind is better simulated both in direction and magnitude. The seasonal cycle of the daily climatological means of four monsoon indices in the forecasts capture the observed onset, peak and withdrawal phases quite well. The ensemble spread of the rainfall indices is about 2-3 mm day-1. The standard deviation of the daily rainfall anomalies in the forecasts is slightly higher over India and equatorial Indian Ocean while that of the low-level horizontal wind anomalies is generally very low compared to analyses.
The forecast errors and predictability errors were examined for rainfall over three monsoon regions. These are the Indian monsoon rainfall (IMR) over the land region of India, the extended Indian monsoon rainfall (EIMR) over (70°E-110°E, 10°N-30°N) and the Asian-Australian monsoon rainfall (AAMR) over (40°E-160°E, 40°S-40°N). The pattern correlation between the daily anomalies of forecast and the daily anomalies of observation/analysis drops to a value of 0.4-0.5 in first day and takes about 12 days to reach zero in the case of individual forecasts. The temporal correlation between forecast and observation/analysis of the rainfall indices for JJAS season shows considerable interannual variability and considerable ensemble spread. The correlation is even negative in several years, which indicates that the intraseasonal variability of the forecast is out of phase with the observation/analysis.
The growth of forecast errors was examined by computing the root mean square (RMS) of the difference in daily anomalies of rainfall indices between forecast and analysis/observation. The RMS forecast errors (averaged over all ensemble members and all years) in IMR and EIMR indices are shown in Fig. 1 for forecasts starting with May, June and July initial conditions. The errors of IMR index in May and June forecasts grow slowly until 1 June and then grow faster before reaching saturation around 1 July. The initial slow growth is related to the low standard deviation during that period. The July forecast error of the IMR index shows only faster growth. The forecast error in the EIMR index grows at the same rate in the forecasts of all three months with the difference that the initial size varies. The initial size and the growth rate in the errors of AAMR index (not shown) are same for all three months, and the errors take about 15-20 days to reach saturation. The RMS forecast errors of the IMR index initiated during active (above-normal) and break (below-normal) phases were found to grow at a faster rate and reach saturation in about 20-30 days while those starting from normal phases grow at a slower rate and reach saturation in about 50-60 days. No such distinction was found in the case of EIMR index.
Following the method of Lorenz (1982), the predictability errors were computed by considering the difference between two forecasts starting one day to four days apart. The RMS predictability errors of 1-day, 2-day, 3-day and 4-day errors in the May forecasts for IMR and EIMR indices are shown in Fig. 2. The initial size of the IMR index error and the subsequent evolution are almost the same for all the four cases. The initial error is about 0.9 mm day-1 and takes about 70 days to reach saturation. In the case of EIMR errors, the initial size of the 1-day error is slightly less than that of the others. The EIMR errors grow slightly faster compared to the IMR errors and reach saturation in about 50 days. In the case of July forecasts (not shown), the initial size of the predictability errors is larger and the errors reach saturation in about 25 days. Quantitative estimates of the growth rates of initially small errors were obtained by using the empirical formula suggested by Lorenz (1982). The doubling time of small errors in the IMR, EIMR and AAMR indices were estimated to be 14, 9 and 5 days, respectively, for the May forecasts while the values for July forecasts were 4, 7 and 5 days, respectively. The doubling time of small errors in the IMR index for forecasts starting from active and break phases is about 2 days while the doubling time for forecasts initiated during the normal phase is 9 days.
3. Predictability of South American monsoon
The December-March (DJFM) seasonal climatology of the precipitation over the South American monsoon region is fairly well simulated by the October forecast of CFS but with less rainfall over the Amazon River Basin (ARB) and more rainfall over the central-east South America (CESA) region compared to observation. The daily rainfall climatology was examined by computing the annual cycles of ARB index (average over 70°W50°W, 5°S5°N) and CESA index (average over 60°W40°W, 20°S10°S). The annual cycle of the CESA index was found to be better simulated than that of the ARB index. From the RMS forecast errors, the doubling time of small errors was found to be 6 and 9 days for the ARB and CESA indices, respectively, using the Lorenz formula. Same estimates of the doubling time of errors were obtained for the RMS predictability errors also. Both the forecast errors and the predictability errors took about 50-60 days to reach saturation.
As a new approach, the predictability of the CFS in the South American monsoon region was investigated by decomposing the forecast fields into different modes in a data adaptive manner in order to find out if there is enhanced predictability in certain modes. For this purpose, multi-channel singular spectrum analysis (MSSA) was applied on daily precipitation anomalies of forecasts and analysis. The dominant MSSA modes that were obtained consisted of a seasonally persistent mode and an oscillatory mode. The persistent mode was found to be related to the El Niño-Southern Oscillation (ENSO) variability while the oscillatory mode was found to have a period of 55 days and northeastward propagation. The spatial structure of the ENSO rainfall mode was found to be fairly well simulated by the CFS compared to the analysis, as shown in Fig. 3(a-d). The daily variability and the interannual variability of the ENSO rainfall mode was also well simulated (Fig. 3e). In the case of the intraseasonal mode, the spatial structure, period and the northeastward propagation were fairly well simulated by the model. However, the phases of the oscillation were quite different from one ensemble member to the other. The RMS forecast errors and RMS predictability errors were separately computed for the ENSO mode and the intraseasonal mode. The errors in the ENSO mode were found to grow very slowly compared to the growth of the total rainfall anomalies, as shown in Fig. 4 for the forecast errors in the ARB index. Similar behavior was also obtained with the predictability errors and also for the CESA index. In the case of the intraseasonal oscillation, the error growth was slow but with oscillatory behavior (not shown), reflecting the fact that the phases of the oscillation are not properly simulated.
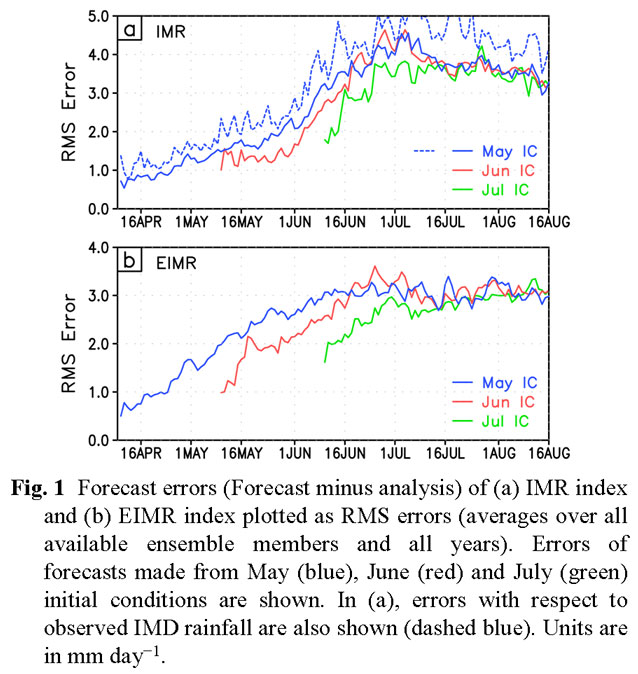
Figure 1

Figure 2
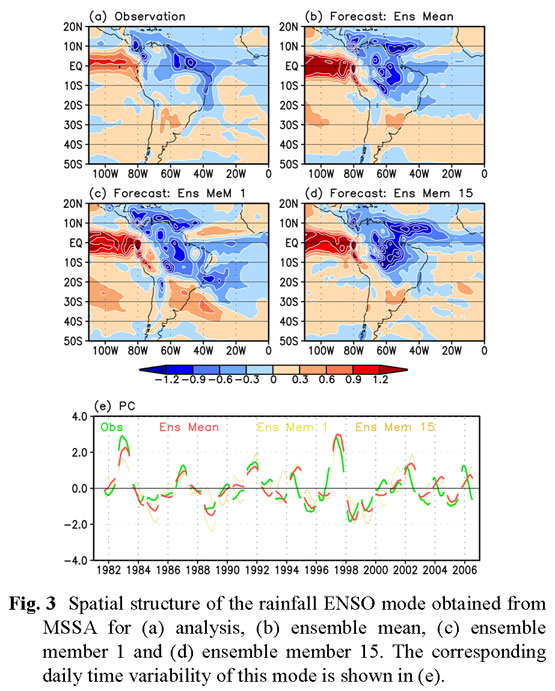
Figure 3

Figure 4
4. Conclusions
In this study, the forecast skill and predictability of the CFS have been assessed on daily and intraseasonal time scales for the South Asian monsoon region and the South American monsoon region. Using retrospective forecasts for the period 1981-2005, the growth of forecast errors and predictability errors in rainfall has been studied in detail for forecasts initiated in different months of the monsoon seasons. The growth rates of small predictability errors have been estimated by applying the Lorenz method. The doubling time of small errors for the South Asian monsoon is found to be in the range of 4-7 days for forecasts initiated in July whereas it is in the range of 5-14 days for forecasts starting in May. The growth of errors associated with forecasts which start from different phases of the monsoon intraseasonal variability has also been examined. For the rainfall averaged over the land points of India, it is found that the errors grow faster in the case of forecasts initiated during active or break phase while they grow slower with forecasts starting from normal phase. The doubling time of small errors in the South American monsoon rainfall was estimated to be in the range of 6-9 days. With a new approach, the predictability of the South American monsoon was assessed by examining the error growth of the dominant modes of the rainfall variability. It was found that the ENSO rainfall mode has very slow growth rate, providing hope for better predictability of certain features of the rainfall.
References
Krishnamurthy, V., and J. Shukla, 2008: Seasonal persistence and propagation of intraseasonal patterns over the Indian monsoon region. Climate Dyn., 30, 353369.
Lorenz, E. N., 1982: Atmospheric predictability experiments with a large numerical model. Tellus, 34, 505-513.
Saha, S., S. Nadiga, C. Thiaw, J. Wang, W. Wang, Q. Zhang, H. M. Van den Dool, H.-L. Pan, S. Moorthi, D. Behringer, D. Stokes, M. Pena, S. Lord, G. White, W. Ebisuzaki, P. Peng, and P. Xie, 2006: The NCEP Climate Forecast System. J. Climate, 19, 3483-3515.
Contact V. Krishnamurthy