US National Oceanic and Atmospheric Administration
Climate Test Bed Joint Seminar Series
NCEP, Camp Springs, Maryland, 24 February 2009
[Print
Version]
Relationship of U.S. Summer Droughts with SST and Soil Moisture:
Distinguishing the Time Scale of Droughts
Renguang Wu1 and James L. Kinter III1,2
1Center for Ocean-Land-Atmosphere Studies, Calverton, Maryland
2Department of Atmospheric, Ocean and Earth Sciences, George Mason University, Fairfax, Virginia
1. Introduction
Droughts and floods are extreme climate events, among the most costly natural disasters. Many studies have demonstrated that droughts over U.S. are associated with cold eastern tropical Pacific (e.g., Piechota and Dracup 1996; Trenberth and Guillemot 1996; Ting and Wang 1997; Rajagopalan et al. 2000; Hoerling and Kumar 2003; Schubert et al. 2004; Seager et al. 2005; Mo and Schemm 2008). Studies have also indicated the contribution of SST anomalies in other regions to U.S. droughts, such as the mid-latitude North Pacific and the tropical North Atlantic Ocean. Another important factor for droughts is a positive soil moisture-precipitation feedback. Initial soil moisture anomalies induced by precipitation variations associated with atmospheric circulation changes can positively feed back on the succeeding precipitation, thus prolonging droughts (Findell and Eltahir 1997; Eltahir 1998; Pal and Eltahir 2001).
The present study investigates the relationship of U.S. summer drought with SST and soil moisture. The analysis distinguishes droughts at different time scales based on the Standardized Precipitation Index (SPI). We are interested in determining (1) which region SST has the most significant relationship with the U.S. summer droughts, (2) which region summer droughts are mostly influenced by remote SST forcing, (3) the role of soil moisture in droughts, and (4) how is the long-term change in the relationship between droughts and SST forcing.
2. Datasets
We use both the Palmer Drought Severity Index (PDSI; Palmer 1965) and the Standardized Precipitation Index (SPI; McKee et al. 1993) for 344 US Climate Divisions over the period 1895-2007, which are obtained from the National Climatic Data Center. The PDSI is based on a water balance model. The PDSI has several limitations, one of which is that it is not spatially comparable across the contiguous U.S. (Alley 1984; Guttman et al. 1992). The SPI is based solely on the probability of precipitation for a given time period. The SPI allows for comparison of precipitation observations at different locations with markedly different climates. A key feature of the SPI is the flexibility to measure drought at different time scales, which allows separating and estimating contributions of different time scales to a specific drought event.
The present study uses monthly soil moisture and evaporation for 344 US Climate Divisions over the period 1932-2005 from the Climate Prediction Center, which is estimated with a one-layer hydrological model driven by observed precipitation and temperature (Fan and van den Dool 2004). Observations at 19 soil moisture stations in Illinois covering the period from 1981 to June 2004 are used for validating the soil moisture-drought relationship. The Illinois soil moisture data (Hollinger and Isard 1994) are obtained from the Global Soil Moisture Data Bank (Robock et al. 2000).
The present study uses the extended reconstruction of monthly mean SST version 2 (ERSST2) for the period 1854-2005 (Smith and Reynolds 2004). This SST dataset has a spatial resolution of 2°.
3. Global SST correlation with the Great Plains drought indices
Figure 1 shows the correlation of the June-August (JJA) drought indices in the Great Plains region (30°-50°N, 95°-105°W) with global SST in JJA and the preceding December-February (DJF). The SPI03, SPI09, and SPI24 indices are selected to represent short-term, medium-term, and long-term droughts, respectively. The correlation distribution in Fig. 1 broadly resembles the El Niño SST pattern, but with pronounced differences. There is a region of positive correlation over the central-eastern tropical Pacific and the tropical Indian Ocean, and weak negative correlation extends northeastward and southeastward from the tropical western Pacific. The largest positive correlation tends to be located on the north and south sides of the equatorial Pacific, which differs markedly from the ENSO SST pattern.
Overall, the correlation distribution for PDSI is most similar to that for SPI09. The correlation for SPI03 displays notable differences from that for SPI24, SPI09, and PDSI. The short-term droughts have a better correlation with simultaneous SST than the preceding DJF SST, with noticeable correlation limited to the tropical Pacific Ocean and the North Atlantic Ocean. The medium-term droughts have a good correlation with tropical Pacific SST in both JJA and DJF. The long-term droughts have a better correlation with the tropical Pacific SST in DJF than JJA. SPI09 and SPI24 display a positive correlation with SST in the tropical Indian Ocean in both DJF and JJA. In comparison, the PDSI has a weaker correlation in the tropical Indian Ocean. The positive correlation extends to the South China Sea and the East Asian coastal region. All the indices show a negative correlation with DJF SST in the middle-latitude North Atlantic Ocean. In the North Atlantic Ocean, the SPI03 and SPI09 have a similar correlation with JJA SST, with positive correlation in the subtropics and negative correlation in the middle latitudes; whereas the correlation for PDSI and SPI24 is only seen in the middle latitudes. There is a negative correlation in the middle latitudes of the North Pacific for PDSI, SPI03, and SPI09 in JJA and for PDSI and SPI09 in DJF, but the area covered is relatively small.
Figure 2 shows the lead-lag correlation of soil moisture and evaporation with reference to JJA drought indices for the Great Plains region. The soil moisture-drought relationship has a strong dependence on the time scale of droughts. The difference is more prominent when the soil moisture leads. For SPI03, the soil moisture shows the highest correlation at lag 0, a quick drop of correlation in the first three lead months. The evaporation correlation is largest at lag 0-1 month. This indicates a sequence of precipitation, soil moisture, and evaporation changes for short-term droughts. For PDSI, the lag-lead correlation is fairly symmetric. For SPI09, the soil moisture has the largest correlation at 1-month lead. The evaporation correlation tends to be symmetric. Soil moisture and evaporation changes apparently lead SPI24. The large correlation in JJA common to different times scales suggests that the contribution of soil moisture to summer droughts may be through surface evaporation although the cause-effect relationship needs to be validated. In comparison, the lag-lead correlation suggests that for short-term droughts, the precipitation impacts are larger than the soil moisture impacts, whereas for medium-term and long-term droughts, the soil moisture impacts are pronounced.
4. U.S. summer drought correlation with the NINO3.4 SST
Figure 3 shows the correlation of JJA drought indices with respect to DJF and JJA NINO3.4 (5°S-5°N, 170°-120°W) SST. There are important differences between short-term and long-term droughts. The SPI03 has a higher correlation with JJA NINO3.4 SST than DJF NINO3.4 SST, whereas the PDSI, SPI09, and SPI24 have a larger correlation with DJF than JJA NINO3.4 SST. Notably, the JJA correlation is large for SPI03 in the Great Plains. The highest DJF correlation for PDSI, SPI09, and SPI24 is found in the Southwest with northward extension into the Great Plains. The magnitude of correlation is close for PDSI and SPI09, while the correlation for SPI24 is smaller.
The ENSO impacts on drought could be through soil moisture and evaporation changes induced by precipitation anomalies due to ENSO forced circulation changes. This is demonstrated by the lead-lag correlation of the drought indices averaged over the Southwest (30º-40ºN, 95º-115ºW) with respect to DJF NINO3.4 SST, which is shown in Fig. 4. The ENSO impacts on PDSI, SPI09, and soil moisture are apparent in DJF. The largest correlation is seen in MAM, lagging the ENSO mature phase by about one season. The induced droughts can persist into spring and summer. This persistence seems to be related to the enhanced evaporation in late spring and summer following the increase in soil moisture. This soil moisture-evaporation effect seems especially important for long-term drought that develops after DJF. Note that the evaporation correlation is small in DJF and becomes large in late-spring and summer, indicating a delayed feedback of soil moisture on droughts through evaporation, which may be related to the annual cycle of insolation and temperature. There is a similar feature in the Great Plains region except that the correlation is weaker (not shown).
5. Long-term changes in the SST-drought correlation
We have examined the long-term changes in the SST-drought relationship with the time. Shown in Fig. 5 is the sliding correlation between DJF NINO3.4 SST or JJA tropical Indian Ocean SST (15°S-15°N, 50°-100°E; TIO) and drought indices using a 31-year window.
The DJF NINO3.4 SST shows a robust positive correlation with PDSI, SPI09, and SPI24 in the Southwest during the whole period, but the magnitude of correlation varies largely (Fig. 5a). The correlation of SPI03 in the Southwest with DJF NINO3.4 SST displays an apparent contrast before and after the mid-1950s. For the Great Plains region, the correlation with the DJF NINO3.4 SST shows an overall weakening with time until the mid-1950s (Fig. 5b). After that, the correlation tends to increase until the early-1980s, which is then followed by a weakening in the correlation. Our results are consistent with Cole and Cook (1998). In comparison, the correlation change is relatively smaller for the Southwest than for the Great Plains.
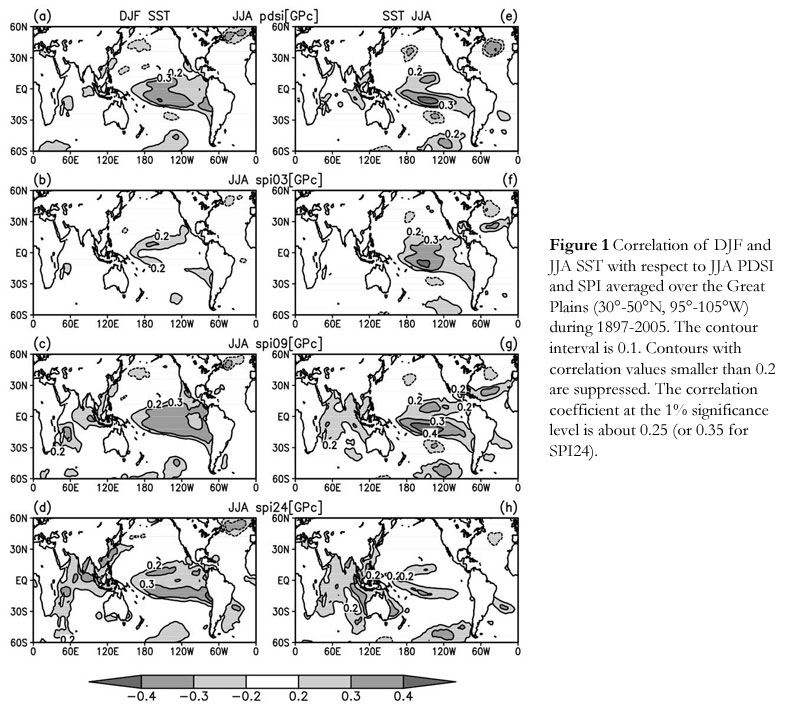
Figure 1
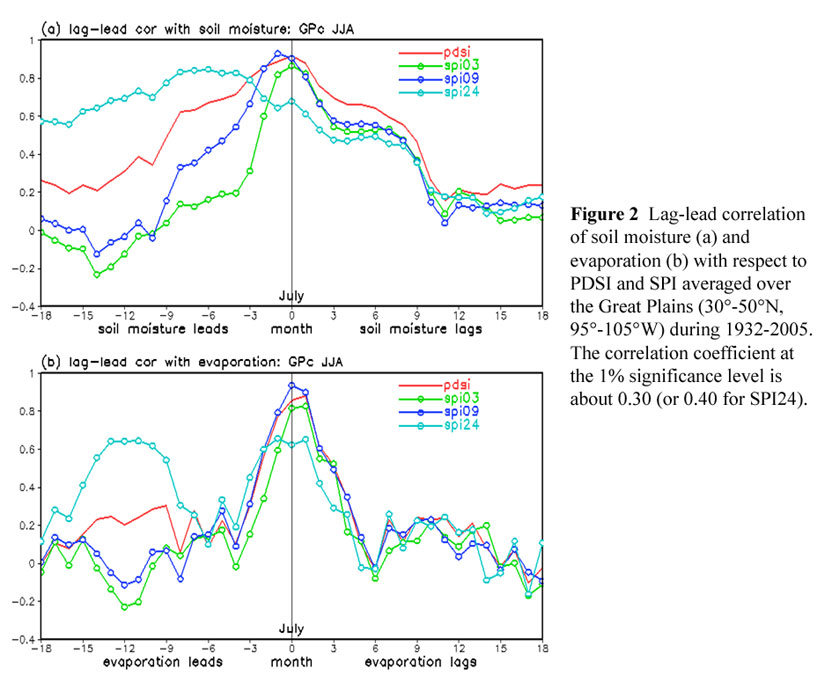
Figure 2

Figure 3
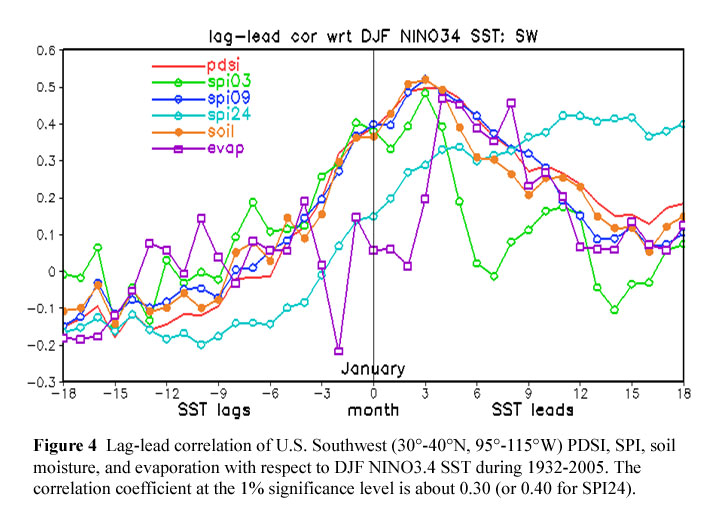
Figure 4

Figure 5
The JJA TIO SST correlation shows a pronounced change with time. Before the late-1930s, the correlation is generally weak for both the Southwest and the Great Plains (Figs. 5c-d). The correlation underwent an obvious increase from the late-1930s to the mid-1940s. After a relatively steady period of about 10 years, the correlation displays an overall decrease with time for PDSI, SPI09, and SPI24 in the Southwest, and for PDSI and SPI09 in the Great Plains. The SPI24 in the Great Plains maintained a steady positive correlation from the 1960s to the mid-1980s (Fig. 5d).
6. Summary
The main results are as follows:
· The relationship of boreal summer U.S. droughts with SST and soil moisture differs significantly between short-term and long-term droughts. The short-term droughts (<= 3 months) are mostly influenced by simultaneous SST forcing. The medium-term and long-term droughts (>= 6 months) are influenced by both preceding and simultaneous SST forcing. The soil moisture change shows obvious leading for medium-term and long-term droughts.
· A dominant remote forcing for U.S. droughts is tropical Pacific SST. Tropical Indian Ocean SST forcing has notable influence on medium-term and long-term droughts. Additional impacts for short-term and medium-term droughts are from the North Atlantic SST forcing.
· The most notable impacts of the tropical Pacific SST forcing on medium-term and long-term droughts are found in the Southwest with extension to the Great Plains. Anomalous soil moisture induced by remote ENSO forcing contributes to the persistence of droughts from winter to summer through anomalous evaporation during late spring to summer.
· The relationship between tropical Pacific SST and boreal summer U.S. droughts show obvious long-term changes. In comparison, the long-term change is more pronounced for the GP droughts than for the SW droughts. Obvious long-term changes are also found in the correlation of U.S. droughts with tropical Indian Ocean SST, especially for JJA SST.
References
Alley, W. M., 1984: The Palmer drought severity index: limitations and assumptions. J. Clim. Appl. Meteorol., 23, 1100-1109.
Cole, J., and E. Cook, 1998: The changing relationship between ENSO variability and moisture balance in the continental United States. Geophys. Res. Lett., 25, 4529-4532.
Eltahir, E. A. B., 1998: A soil moisture-rainfall feedback mechanism. 1: Theory and observations. Water Resources Research, 34, 765-776.
Fan, Y., and H. M. van den Dool, 2004: Climate Prediction Center global monthly soil moisture data set at 0.5° resolution for 1948 to present. J. Geophys. Res., 109, D10102, doi:10.1029/2003JD004345.
Findell, K. L., and E. A. B. Eltahir, 1997: An analysis of the soil moisture-rainfall feedback, based on direct observations from Illinois. Water Resources Research, 33, 725-735.
Guttman, N. B., J. R. Wallis, and J. R. M. Hosking, 1992; Spatial comparability of the Palmer Drought Severity Index. Water Resour. Bull., 28, 1111-1119.
Hoerling, M., and A. Kumar, 2003: The perfect ocean for drought. Science, 299, 691-694.
Hollinger, S. E., and S. A. Isard, 1994: A soil moisture climatology of Illinois. J. Climate, 7, 822-833.
McKee, T. B., N. J. Doesken, and J. Kleist, 1993: The relationship of drought frequency and duration to time scales. Preprints, Eighth Conf, on Applied Climatology, Anaheim, CA, Amer. Meteor. Soc., January 17-22, 179-184.
Mo., K. C., and J. E. Schemm, 2008: Drought and persistent wet spells over the United States and Mexico. J. Climate, 21, 980-994.
Pal, J. S., and E. A. B. Eltahir, 2001: Pathways relating soil moisture conditions to future summer rainfall with a model of the land-atmosphere system. J. Climate, 14, 1227-1242.
Palmer, W. C., 1965: Meteorological drought. Research Paper No. 45, U.S. Weather Bureau, 58pp.
Piechota, T. C., and J. A. Dracup, 1996: Drought and regional hydrologic variation in the United States: Associations with the El Niño-Southern Oscillation. Water Resources Research, 32, 1359-1373.
Rajagopalan, B., E. Cook, U. Lall, and B. K. Ray, 2000: Spatialtemporal variability of ENSO and SST teleconnections to summer drought over the United States during the twentieth century. J. Climate, 13, 4244-4255.
Robock, A., K. Y. Vinnikov, G. Srinivasan, J. K. Entin, S. E. Hollinger, N. A. Speranskaya, S. Liu, and A. Namkhai, 2000: The global soil moisture data bank. Bull. Amer. Meteor. Soc., 81, 1281-1299.
Schubert, S. D., M. J. Suarez, P. J. Pegion, R. D. Koster, and J. T. Bacmeister, 2004: Causes of long-term drought in the U.S. Great Plains. J. Climate, 17, 485-503.
Seager, R., Y. Kushnir, C. Herweijer, M. Naik, and J. Velez, 2005: Modeling of tropical forcing of persistent droughts and pluvials over western North America: 1856-2000. J. Climate, 18, 4065-4088.
Smith, T. M., and R. W. Reynolds, 2004: Improved extended reconstruction of SST (1854-1997). J. Climate, 17, 2466-2477.
Ting, M., and H. Wang, 1997: Summertime U.S. precipitation variability and its relation to Pacific sea surface temperature. J. Climate, 10, 1853-1873.
Trenberth, K. E., and C. J. Guillemot, 1996: Physical processes involved
in the 1988 drought and 1993 floods in North America. J. Climate, 9,
1288-1298.
Contact Renguang Wu